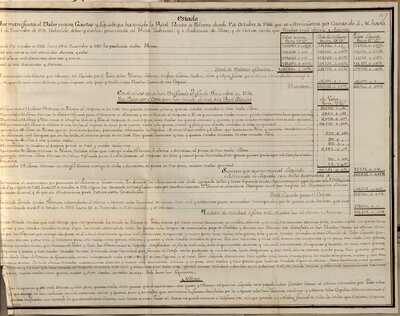
Inter-Agency Cooperation in Industry Inspections
Throughout 1771, Gálvez worked with many local officials to produce financial reports for their respective industries. Before he could make suggestions about how to improve productivity, the Visitador needed a clear picture of current conditions. He relied on members of community and government workers to provide him with that information. Sometimes these reports took the form of written descriptions. However, oftentimes, Gálvez and the colonial officials of New Spain utilized a different presentation style: the table.
Utilizing tables helped include a large amount of information--costs, profits, and changes in production levels over time--in one, easy-to-read document. Gálvez was occasionally involved directly in the process of creating the tables. However, because he had so many industries to inspect, Gálvez frequently requested that local managers prepare and send him this data for him to review.
On July 31, 1771, the Visitador made one such request to the Treasury Department. Gálvez sent the order to head accountant Santiago Abad, along with “the accountants of his choosing.” The letter was brief. They had to create an accurate table that contained the amounts of production and expenditures for the royal treasury in New Spain from the year 1770.
Members of the Visitador’s staff often assisted in the preparation of these informative documents as well. Also in July of 1771, Gálvez’s personal accountant Francisco Xavier de Corres created the table featured here. In it is a section that illustrates income (Productos) versus expenditure (Gastos). It compares the amounts for three periods: 1755-1760, 1760-1766, and 1766-1771. The author demarcated each period by naming it after the Viceroy who ruled New Spain at that time: Agustín de Ahumada y Villalón, the Marquess of Amarillas, for the first; Joaquín de Montserrat, the Marquess of Cruillas, for the second; and Carlos Francisco de Croix, the Marquess of Croix, for the third.
Gálvez also worked with the mining industry to procure a similar report about mercury production. This table helped identify changes over time in the output of the mines. It tracked production levels between 1765 and 1770. The amount of mercury processed from the mines remained relatively stable, although there was a high point in 1768.
Still in the same year (1771), the Visitador acquired a table for tobacco production levels. In this document, the goal was to understand the variance between tobacco-growing zones. It demonstrated, for example, that the city of Puebla and its surrounding areas were the highest producing region, while Córdoba was the least productive.
Accounting Tables in Gálvez's Informe General, item G206 in the Genaro García Manuscript Collection